Understanding the Transaction Provenance Graph: A Deep Dive into BTC Mixer Transparency
The transaction provenance graph has emerged as a critical tool in the analysis of Bitcoin transactions, particularly within the niche of BTC mixers. As privacy-enhancing technologies like Bitcoin mixers gain traction, understanding the flow of funds through these systems becomes increasingly important for both users and regulators. This article explores the intricacies of the transaction provenance graph, its role in tracking mixed transactions, and how it intersects with the functionality of Bitcoin mixers.
By examining the structure and applications of the transaction provenance graph, we can better appreciate its significance in maintaining transparency while preserving user privacy. Whether you're a Bitcoin enthusiast, a privacy advocate, or a compliance professional, this guide will provide valuable insights into how transaction provenance graphs work and why they matter in the context of BTC mixers.
The Fundamentals of Transaction Provenance Graphs
What Is a Transaction Provenance Graph?
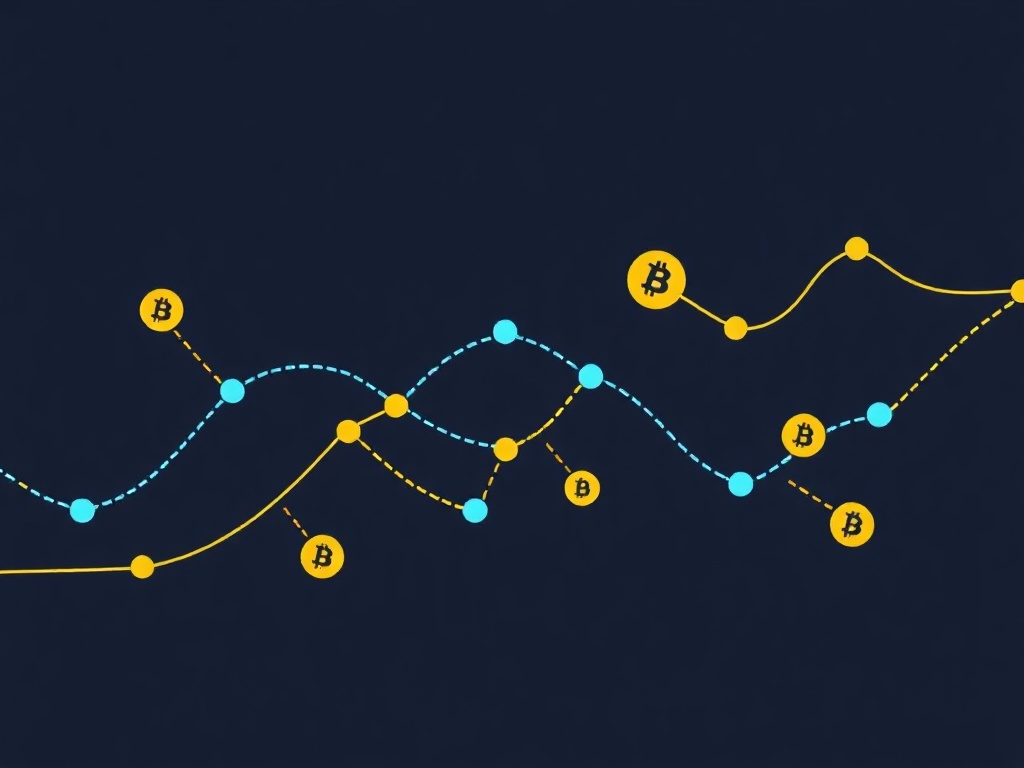
A transaction provenance graph is a visual or analytical representation of the flow of cryptocurrency transactions across the blockchain. Unlike traditional transaction graphs that simply map inputs and outputs, a provenance graph delves deeper into the origin and destination of funds, tracking their journey through multiple addresses and transactions.
In the context of Bitcoin, the transaction provenance graph helps analysts identify patterns, detect suspicious activities, and trace the movement of funds even after they have been mixed. This is particularly relevant for BTC mixers, which are designed to obscure the link between senders and receivers by shuffling coins through a series of intermediate addresses.
Key Components of a Transaction Provenance Graph
A well-constructed transaction provenance graph typically includes the following elements:
- Nodes: Represent Bitcoin addresses or transactions. Each node can be an input, output, or a mixing service address.
- Edges: Represent the flow of funds between nodes. These edges can be weighted to indicate transaction volume or frequency.
- Clusters: Groups of nodes that share common characteristics, such as addresses controlled by the same entity or transactions processed by a BTC mixer.
- Labels: Metadata attached to nodes or edges, such as timestamps, transaction fees, or mixing service identifiers.
By analyzing these components, investigators can reconstruct the path of funds and identify potential points of interest, such as mixing services or exchange withdrawals.
How Transaction Provenance Graphs Differ from Traditional Transaction Graphs
While traditional transaction graphs focus solely on the direct relationships between inputs and outputs, a transaction provenance graph provides a more nuanced view by incorporating additional layers of data. For example:
- Multi-hop tracing: Traditional graphs may stop at the first mixing service, whereas provenance graphs can follow funds through multiple layers of obfuscation.
- Address clustering: Provenance graphs often use heuristics to group addresses controlled by the same entity, revealing patterns that might not be visible in a simple transaction graph.
- Temporal analysis: By incorporating timestamps, provenance graphs can highlight suspicious timing patterns, such as rapid movements through a mixer.
These differences make the transaction provenance graph an indispensable tool for both privacy advocates and law enforcement agencies.
The Role of Transaction Provenance Graphs in BTC Mixers
How BTC Mixers Work
BTC mixers, also known as Bitcoin tumblers, are services designed to enhance the privacy of Bitcoin transactions by breaking the on-chain link between senders and receivers. They achieve this by pooling funds from multiple users and redistributing them in a way that obscures their origin. The process typically involves the following steps:
- Deposit: Users send their Bitcoins to the mixer's address.
- Shuffling: The mixer combines these funds with those of other users and redistributes them to new addresses.
- Withdrawal: Users receive their mixed Bitcoins at a new address, ideally untraceable to their original source.
While BTC mixers are effective at enhancing privacy, they also pose challenges for regulators and investigators seeking to track illicit activities. This is where the transaction provenance graph becomes invaluable.
Analyzing Mixed Transactions with a Provenance Graph
A transaction provenance graph can be used to trace mixed transactions by identifying key nodes and edges within the mixing process. For example:
- Mixer Input Addresses: These are the addresses where users deposit their funds into the mixer. In a provenance graph, these nodes often appear as high-degree hubs, connected to multiple user deposits.
- Mixer Output Addresses: These are the addresses where mixed funds are sent. By analyzing the flow of funds from mixer input to output, investigators can identify patterns that may indicate mixing activity.
- Intermediate Addresses: Some mixers use intermediate addresses to further obscure the flow of funds. A provenance graph can help trace these addresses and identify their connections to the mixer.
By mapping these relationships, a transaction provenance graph can reveal the structure of a BTC mixer and its operational patterns, even when the mixer employs advanced obfuscation techniques.
Case Study: Tracing a Mixed Transaction Using a Provenance Graph
To illustrate the power of a transaction provenance graph, let's consider a hypothetical case involving a Bitcoin mixer:
- A user sends 1 BTC to a mixer's deposit address.
- The mixer pools this with 9 BTC from other users, totaling 10 BTC.
- The mixer redistributes the 10 BTC to 10 new addresses, each receiving 1 BTC.
- The original user withdraws their 1 BTC from one of these new addresses.
In a traditional transaction graph, this process might appear as a single input and output, making it difficult to trace the flow of funds. However, in a transaction provenance graph, the relationships between the mixer's deposit address, the intermediate pooling address, and the final withdrawal addresses become clear. This allows investigators to reconstruct the mixing process and identify the mixer's operational structure.
Challenges in Analyzing Mixed Transactions with Provenance Graphs
While the transaction provenance graph is a powerful tool, it is not without its challenges. Some of the key difficulties include:
- Address Reuse: If users or mixers reuse addresses, it can complicate the tracing process by creating false connections in the graph.
- Privacy Coins and Off-Chain Mixers: Some mixers operate off-chain or use privacy coins like Monero, which are not directly traceable on the Bitcoin blockchain. This limits the effectiveness of a provenance graph in such cases.
- Dynamic Mixing Strategies: Advanced mixers may employ dynamic strategies, such as varying the number of intermediate addresses or using time delays, to further obscure the flow of funds.
- Legal and Ethical Considerations: The use of provenance graphs to trace mixed transactions raises questions about privacy and surveillance. Balancing the need for transparency with the right to financial privacy is an ongoing debate.
Despite these challenges, the transaction provenance graph remains a critical tool for investigators and analysts working in the BTC mixer niche.
Building and Interpreting Transaction Provenance Graphs
Tools and Techniques for Constructing Provenance Graphs
Creating a transaction provenance graph requires specialized tools and techniques. Some of the most commonly used methods include:
- Blockchain Explorers: Tools like Blockchain.com, Blockstream.info, and OXT Research allow users to visualize transaction flows and construct basic provenance graphs.
- Graph Databases: Databases like Neo4j or ArangoDB can store and analyze complex transaction data, enabling the construction of detailed provenance graphs.
- Machine Learning: Advanced algorithms can be used to identify patterns in transaction data, such as clustering addresses or detecting anomalies in mixing behavior.
- APIs and Data Feeds: Services like Chainalysis, CipherTrace, and TRM Labs provide APIs that can be used to build and analyze provenance graphs programmatically.
Each of these tools offers unique advantages, and the choice of method often depends on the specific use case and the level of detail required.
Step-by-Step Guide to Building a Provenance Graph
Building a transaction provenance graph involves several key steps. Below is a simplified guide to the process:
- Data Collection: Gather transaction data from blockchain explorers, APIs, or other sources. This data should include inputs, outputs, timestamps, and any relevant metadata.
- Address Clustering: Use heuristics or machine learning to group addresses controlled by the same entity. This step is crucial for identifying mixer addresses and their connections.
- Graph Construction: Create nodes for each address or transaction and edges to represent the flow of funds. Use graph databases or visualization tools to build the graph.
- Analysis: Apply algorithms to identify patterns, such as high-degree nodes (potential mixers) or suspicious timing patterns (rapid movements through a mixer).
- Visualization: Use tools like Gephi, Cytoscape, or custom-built dashboards to visualize the provenance graph and highlight key findings.
This process can be time-consuming and resource-intensive, but the insights gained from a well-constructed transaction provenance graph are invaluable for understanding the flow of funds in the Bitcoin ecosystem.
Interpreting Provenance Graphs: Key Metrics and Patterns
When interpreting a transaction provenance graph, several key metrics and patterns can provide valuable insights:
- Degree Centrality: Measures the number of connections a node has. High-degree nodes may indicate mixer addresses or exchange hot wallets.
- Betweenness Centrality: Identifies nodes that act as bridges between different parts of the graph. These nodes may represent critical points in the mixing process.
- Clustering Coefficient: Measures the degree to which nodes in a graph tend to cluster together. High clustering coefficients may indicate coordinated mixing activity.
- Temporal Patterns: Analyzing the timing of transactions can reveal suspicious behavior, such as rapid movements through a mixer or coordinated withdrawals.
By focusing on these metrics, analysts can identify potential mixing services, track the flow of illicit funds, and gain a deeper understanding of the Bitcoin ecosystem.
Common Pitfalls in Provenance Graph Analysis
While provenance graphs are powerful tools, they are not infallible. Some common pitfalls to avoid include:
- Over-Reliance on Heuristics: Heuristics like address clustering can produce false positives or negatives. Always cross-reference findings with additional data sources.
- Ignoring Off-Chain Activity: Provenance graphs are limited to on-chain data. Off-chain activities, such as Lightning Network transactions or privacy coin usage, may not be captured.
- Assuming Address Ownership: Address clustering does not guarantee that a single entity controls all clustered addresses. Always verify findings with external data.
- Neglecting Legal and Ethical Considerations: Provenance graph analysis must comply with legal and ethical standards. Avoid using data in ways that infringe on privacy rights.
By being aware of these pitfalls, analysts can ensure that their use of the transaction provenance graph is both effective and responsible.
Applications of Transaction Provenance Graphs in the BTC Mixer Niche
Enhancing Privacy and Security for Bitcoin Users
For privacy-conscious Bitcoin users, the transaction provenance graph can serve as a tool for verifying the effectiveness of BTC mixers. By analyzing the structure of a provenance graph, users can assess whether a mixer successfully obscures the flow of their funds. For example:
- Degree of Mixing: A well-mixed transaction should have a high degree of separation between the input and output addresses in the provenance graph.
- Address Diversity: The presence of multiple intermediate addresses in the graph can indicate a robust mixing process.
- Temporal Separation: Delays between deposits and withdrawals can further obscure the flow of funds, making it harder to trace in the provenance graph.
By using a transaction provenance graph to evaluate mixers, users can make more informed decisions about which services to trust with their privacy.
Regulatory Compliance and Anti-Money Laundering (AML)
For regulators and compliance professionals, the transaction provenance graph is an essential tool for monitoring BTC mixers and detecting illicit activities. Some key applications include:
- Identifying Suspicious Mixers: Provenance graphs can help regulators identify mixers that are frequently used in illicit transactions, such as those associated with darknet markets or ransomware attacks.
- Tracking Illicit Funds: By tracing the flow of funds through provenance graphs, investigators can identify the sources and destinations of illicit Bitcoin transactions.
- Assessing Mixer Effectiveness: Regulators can use provenance graphs to evaluate the effectiveness of mixers in obscuring the flow of funds, which can inform policy decisions and enforcement actions.
In jurisdictions where BTC mixers are subject to AML regulations, the transaction provenance graph can provide the evidence needed to enforce compliance and prosecute illicit activities.
Academic Research and Blockchain Forensics
The transaction provenance graph is also a valuable tool for academic researchers and blockchain forensic experts. Some key areas of research include:
- Mixing Service Analysis: Researchers can use provenance graphs to study the operational patterns of BTC mixers, such as their fee structures, withdrawal processes, and address reuse policies.
- Privacy Enhancements: By analyzing the weaknesses of existing mixers, researchers can propose improvements to enhance user privacy while maintaining compliance with regulatory standards.
- Economic Impact: Provenance graphs can be used to study the economic impact of mixing services on the Bitcoin ecosystem, such as their effect on transaction fees and network congestion.
Through academic research, the transaction provenance graph contributes to a deeper understanding of Bitcoin privacy technologies and their broader implications.
Real-World Examples of Provenance Graph Analysis
Several high-profile cases have demonstrated the power of the transaction provenance graph in tracking mixed transactions. For example:
- Silk Road Investigation: Law enforcement agencies used provenance graphs to trace the flow of funds through the Silk Road darknet market, ultimately leading to the arrest of its operator, Ross Ulbricht.
- Twitter Bitcoin Scam: In 2020, a group of hackers used a Bitcoin mixer to launder funds obtained from a Twitter scam. Provenance graphs helped investigators trace the flow of funds and identify the perpetrators.
- Ransomware Payments: Provenance graphs have been used to track ransomware payments, which are often routed through mixers to obscure their origin. This has enabled law enforcement to disrupt ransomware operations and recover stolen funds.
These examples highlight the critical role of the transaction provenance graph in combating illicit activities on the Bitcoin blockchain.
Future Trends and Innovations in Transaction Provenance Graphs
Advancements in Graph Analysis Techniques
The field of transaction provenance graph analysis is rapidly evolving, with new techniques and technologies emerging to enhance its capabilities. Some of the most promising advancements include:
- Graph Neural Networks (GNNs): These machine learning models are designed to analyze graph-structured data, making them ideal for provenance graph analysis. GNNs can identify complex patterns and relationships that traditional methods might miss.
- Temporal Graph Networks: These models incorporate time as a dimension in graph analysis, allowing for more accurate tracking of dynamic processes like Bitcoin mixing.
- Privacy-Preserving Techniques: Innovations such as zero-knowledge proofs and homomorphic encryption are being explored to enable provenance graph analysis without compromising user privacy.
As these techniques mature, they will likely become integral to the analysis of transaction provenance graphs, enabling more accurate and efficient tracking of mixed transactions.

Unlocking Crypto Investment Insights with the Transaction Provenance Graph
As a crypto investment advisor with over a decade of experience, I’ve seen firsthand how the transaction provenance graph is transforming the way investors assess digital assets. This powerful tool maps the flow of funds across blockchain networks, revealing patterns that are invisible in raw transaction data. For institutional and retail investors alike, it’s not just about tracking transactions—it’s about uncovering hidden risks, identifying market manipulation, and validating the legitimacy of assets. Whether you’re evaluating a new DeFi protocol or assessing the credibility of a token, the transaction provenance graph provides a forensic-level view that traditional financial analysis simply can’t match.
Practically speaking, the transaction provenance graph is a game-changer for due diligence. I’ve used it to trace the origin of suspicious fund movements, detect wash trading in NFT markets, and even uncover illicit activities tied to certain tokens. For example, when analyzing a new altcoin, I can quickly see if its liquidity is concentrated in a few wallets or if it’s being artificially pumped through coordinated trades. This level of transparency is unparalleled in traditional finance, where opacity often masks underlying risks. Investors who leverage this tool gain a competitive edge—one that can mean the difference between a high-conviction opportunity and a costly mistake.